Radx2Grid Convective Stratiform
From Lrose Wiki
Overview
One important functionality of Radx2Grid is the ability to distinguish between convective stratiform and separation precipitation in gridded radar data. The algorithm is a modified version of the process described by Steiner et al. (1995), which analyzes the radar reflectivity field and flags grid points as convective or stratiform precipitation. Distinguishing between the two precipitation types is important due to the distinct profiles of vertical velocity, microphysical processes, and diabatic heating in convective and stratiform precipitation. This page will describe the basic methodology and point the user to key parameters.
Separation Process
The default setting of Radx2Grid is to not perform the convective stratiform separation; performing the separation and saving the results to the gridded file must be enabled in the Radx2Grid parameter file (identify_convective_stratiform_split; line 2428).
As in Steiner et al. (1995), the first step identifies definite convection. This process is done by flagging all points that exceed a user-defined reflectivity threshold as convective (conv_strat_dbz_threshold_for_definite_convection; line 2491). Note that this threshold will vary in continental and tropical convection (e.g., 53 vs 40/45 dBZ). For each point flagged as definite convection, all points within the radius of convective influence are also flagged as convection (conv_strat_convective_radius_km; line 2504).
While Steiner et al. (1995) next identifies any remaining convection by calculating the reflectivity difference between a point and its neighbors, Radx2Grid instead analyzes the "texture" of the reflectivity field, which is defined as [math]\displaystyle{ \sqrt{\sigma(dBZ^2)} }[/math]. The texture is calculated using all points within the user-defined texture radius of the central point (conv_strat_texture_radius_km; line 2519) and is only valid if a sufficient fraction of the grid points within the texture radius have good data (conv_strat_min_valid_fraction_for_texture; line 2533). All locations where the texture exceeds a user-defined threshold are also defined as convection (conv_strat_min_texture_for_convection; line 2547). Similar to the first step, all points within the radius of convective influence are also flagged as convection.
Although Steiner et al. (1995) performs the aforementioned analysis at a single horizontal level, Radx2Grid uses a vertical layer of a user-defined depth to determine convective and stratiform precipitation (conv_strat_min_valid_height and con_strat_max_valid_height; lines 2452, 2464).
Note: the algorithm is currently undergoing significant upgrades that will be included in a future version of LROSE, possibly in a standalone application instead of within Radx2Grid.
Example
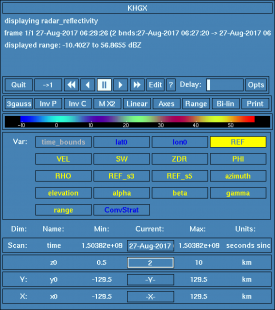
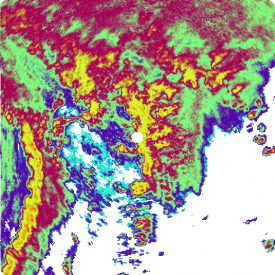
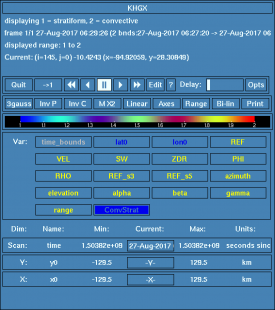
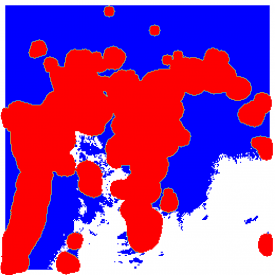
Example output from Hurricane Harvey (2017) from the Houston radar (KHGX) is shown below. In this example, the definite convective threshold was 45 dBZ, the convective radius is 5 km, the minimum texture is 15 dBZ, and the texture radius is 7 km. Red regions indicate convective precipitation.
References
Steiner, M., Houze , R. A., Jr., & Yuter, S. E. (1995). Climatological Characterization of Three-Dimensional Storm Structure from Operational Radar and Rain Gauge Data, Journal of Applied Meteorology and Climatology, 34(9), 1978-2007. Link


