RadxPid fuzzylogic
From Lrose Wiki
Overview
RadxPid uses polarimetric variables to provide a best estimate of the dominant particle type at every gate within the three-dimensional scan. The categorization is done by using a fuzzy logic algorithm, which describes the likelihood that different ranges of polarimetric variables are produced by different particles. RadxPid uses the method described by Vivekanadan et al. (1999) and this page will highlight the most important concepts in the algorithm.
Fuzzy Logic Basics
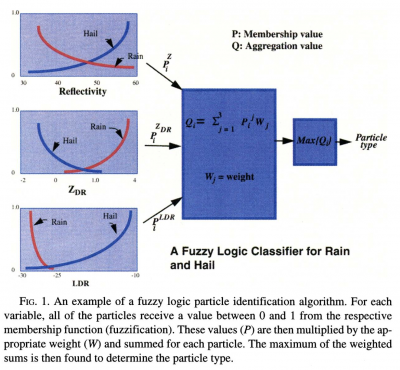
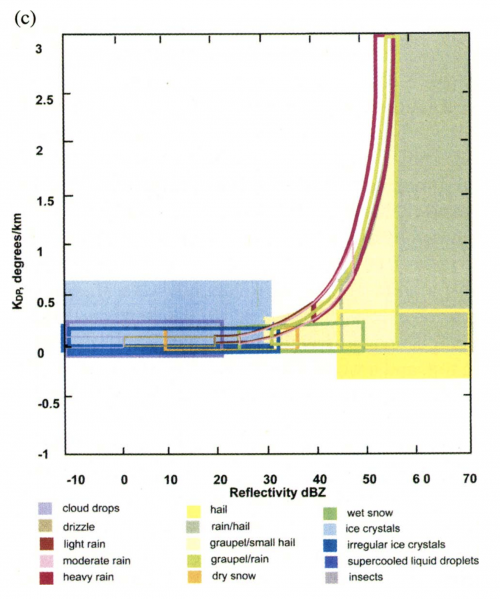
As described in Vivekanadan et al. (1999), fuzzy logic methods are similar to probabilistic methods in that they describe uncertainty on a scale from 0 to 1, except fuzzy logic categories do not have hard boundaries. For example, radar gates that have rain or hail can have similar reflectivity values, although rain is more likely to have weaker reflectivity values than hail. The fuzzy logic method assigns a likelihood (i.e., a membership value p) that rain or hail is associated with a particular reflectivity value defined by a membership function as shown in the image below. Membership functions can be created for a single polarimetric variable and combinations of polarimetric variables. Thus, membership functions are applied to the polarimetric data at each gate, providing a membership value (from 0 to 1) for each particle type and polarimetric variable/combination. Each membership value is then multiplied by a predetermined weight and the weighted values from each polarimetric variable/combination are summed, which produces an aggregation value for each particle category. The particle type associated with the largest aggregation value is determined to be the dominant particle type and the gate is assigned the corresponding PID value.
Fuzzy Logic in RadxPid
The membership functions and weights are all set in the PID thresholds file. Due to variations in the polarimetric responses of particles to radar wavelength and transmission, different relationships are required for different radars (e.g., S- vs X-band, simultaneous vs alternating transmission). The following examples will all assume a simultaneously transmitting S-band radar (e.g., WSR-88D).
18 PID categories are possible, including categories like heavy rain and insects (lines 14-31; order corresponds to the returned numerical PID value). Weights for each variable are assigned on line 63 and include temperature, [math]\displaystyle{ Z_H }[/math], [math]\displaystyle{ Z_{DR} }[/math], [math]\displaystyle{ K_{DP} }[/math], [math]\displaystyle{ LDR }[/math], [math]\displaystyle{ \rho_{HV} }[/math], [math]\displaystyle{ \sigma(Z_{DR}) }[/math], and [math]\displaystyle{ \sigma(\phi_{DP}) }[/math]. Absolute thresholds are included in lines 67-95. For example, any gates where [math]\displaystyle{ Z_{DR} \lt = 0 }[/math] will return a membership value of 0 for Heavy Rain (line 81).
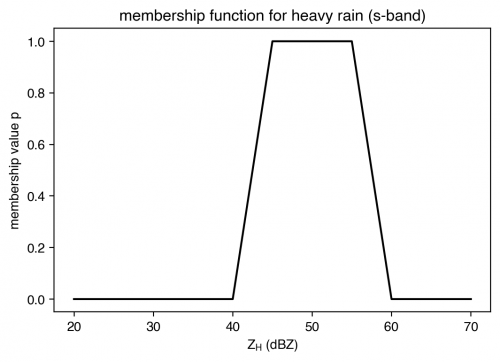
The single-variable membership functions are described in lines 106-123. The first column describes the polarimetric variable ([math]\displaystyle{ Z_H }[/math]) and the PID category, the second column describes the full range of [math]\displaystyle{ Z_H }[/math] values considered, and the remaining columns describe the membership function shape. An example of the [math]\displaystyle{ Z_H }[/math] membership function for Heavy Rain is shown in the image below. Below 40 dBZ (column 3) and above 60 dBZ (column 6) the membership value is 0, between 45 and 55 dBZ (columns 4 and 5) the membership value is 1, and between 40-45 dBZ and 55-60 dBZ the membership function transitions linearly. Categories with only 3 columns either indicate that the membership value remains 1 at the end of the full [math]\displaystyle{ Z_H }[/math] range or that the decrease to 0 occurs linearly to end of the range.
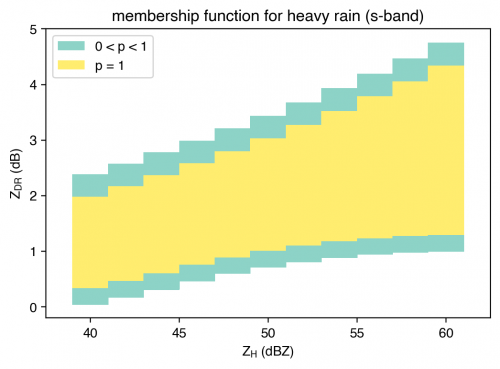
The remainder of the file describes the two-dimensional membership functions. An example of the [math]\displaystyle{ Z_H }[/math]-[math]\displaystyle{ Z_{DR} }[/math] membership function for Heavy Rain is shown below (lines 170-180). Yellow regions indicate where the membership value is 1 and blue regions indicate the linear transition from 1 to 0. In the PID thresholds file, the distribution of likely [math]\displaystyle{ Z_{DR} }[/math] values for Heavy Rain shifts to larger values as [math]\displaystyle{ Z_H }[/math] increases. Raindrops become increasingly oblate as they grow, in contrast to hail, which has [math]\displaystyle{ Z_{DR} }[/math] values closer to 0 since hail is more spherical.
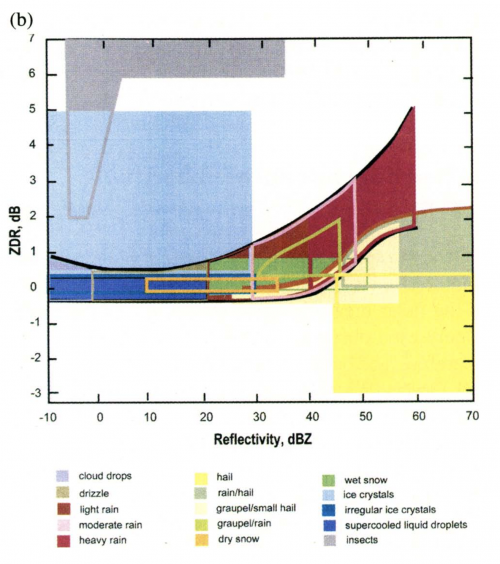
An example of all the membership functions for [math]\displaystyle{ Z_H }[/math]-[math]\displaystyle{ Z_{DR} }[/math] and [math]\displaystyle{ Z_H }[/math]-[math]\displaystyle{ K_{DP} }[/math] are shown below (Vivekanadan et al. 1999). The amount of overlap between the different PID categories reinforces the need for the fuzzy logic algorithm. Many different hydrometeors have similar polarimetric values.
Example
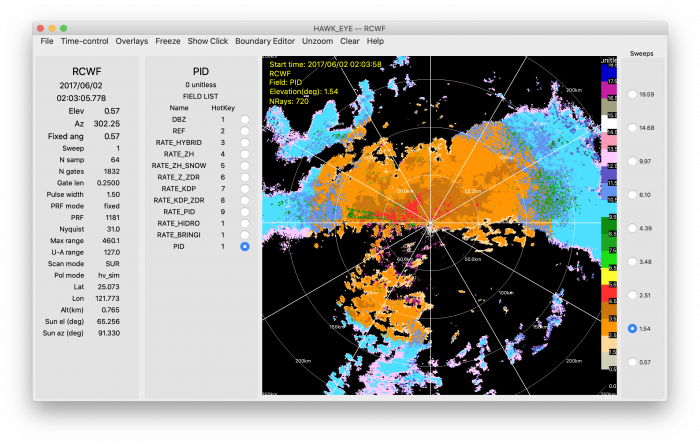
An example of RadxPid output from a radar in northern Taiwan is shown below. The orange, brown, and red colors indicate light, moderate, and heavy rain, respectively. The blue and purple colors at larger range indicate dry and wet snow and reflect the increasing beam height with range (note: this sweep is from a 1.5º elevation angle).
References
Vivekanandan, J., Zrnic, D. S., Ellis, S. M., Oye, R., Ryzhkov, A. V., & Straka, J. (1999). Cloud Microphysics Retrieval Using S-Band Dual-Polarization Radar Measurements, Bulletin of the American Meteorological Society, 80(3), 381-388. Link
