Difference between revisions of "RadxQpe expanded"
From Lrose Wiki
| Line 21: | Line 21: | ||
The two images below show the precipitation rate from RadxRate (left image; 0.5º elevation angle) and RadxQpe (right image). In the RadxRate image, the light green color (associated with precipitation rates between 0-3 mm/hr) covers a large area, whereas the RadxQpe image shows far less coverage of the lightest precipitation rates (the minimum valid rate was 0.5 mm/hr for this example). | The two images below show the precipitation rate from RadxRate (left image; 0.5º elevation angle) and RadxQpe (right image). In the RadxRate image, the light green color (associated with precipitation rates between 0-3 mm/hr) covers a large area, whereas the RadxQpe image shows far less coverage of the lightest precipitation rates (the minimum valid rate was 0.5 mm/hr for this example). | ||
| + | |||
| + | [[File:Rate_rhybrid.png|500px]][[File:Qpe_rhybrid.png|500px]] | ||
===== '''Radar Beam Height''' ===== | ===== '''Radar Beam Height''' ===== | ||
Revision as of 22:12, 26 January 2021
Overview
The goal of RadxQpe is to provide the best two-dimensional estimate of rainfall at ground level. To do so, RadxQpe must account for areas of weak signal, elevated terrain, and the height of the radar beam. This page will walk through how the application handles these factors to produce the end result.
Elevated Terrain
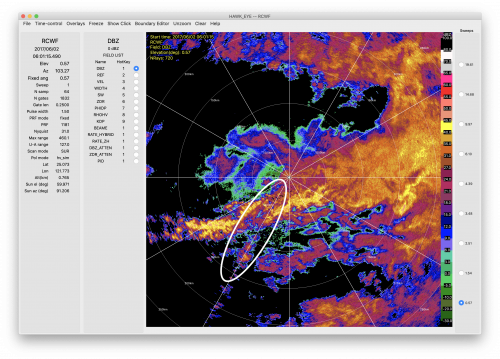
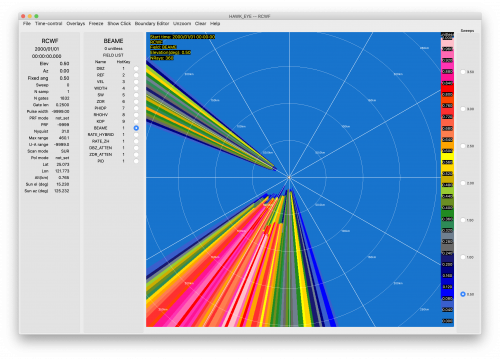
In certain regions, mountain ranges block radar beams at lower elevation angles, as shown in the example of a 0.5º elevation sweep from northern Taiwan below (left image). The white oval highlights weak reflectivity values in the middle of the east-west line of intense reflectivity values. The region of weak reflectivity corresponds to beam blockage by Taiwan's Central Mountain Range, as shown in the beam blockage (fractional value; right image).
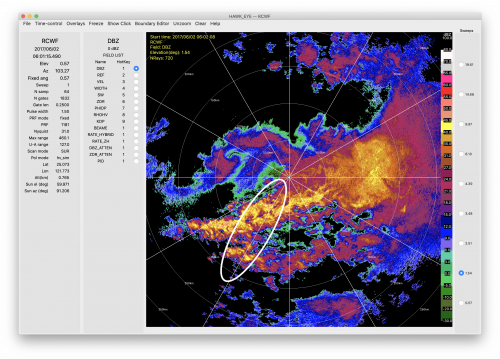
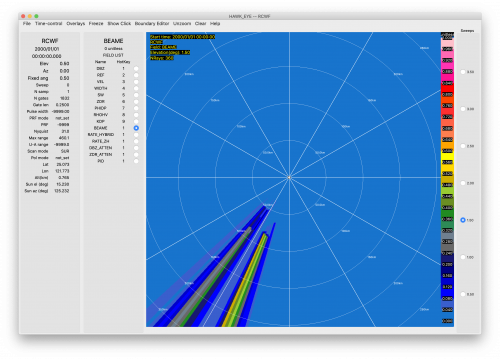
However, radars often scan three-dimensional volumes and at the higher elevation angle of 1.5º, the band of intense reflectivity values in the oval is no longer discontinuous (left image) and the beam blockage is far weaker (right image).
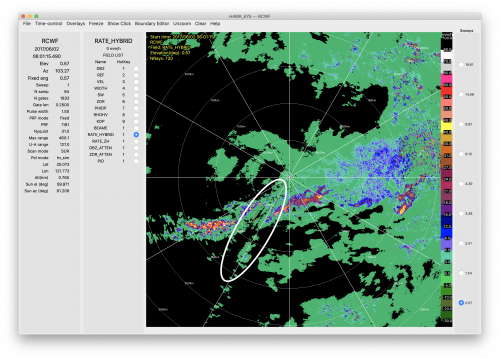
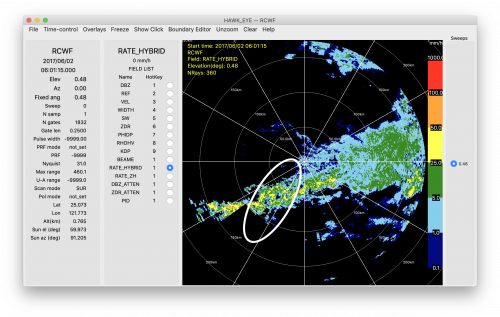
RadxQpe takes advantage of the three-dimensional radar volume to look at different elevation angles in regions where terrain exists to find to elevation angles closest to ground level. This process is done by linking to the output from RadxBeamBlock in the RadxQpe parameter file. While the estimated precipitation rate from lowest elevation angle in the RadxRate file (left image) is discontinuous, RadxQpe's estimate of surface precipitation (right image) displays the precipitation rates occurring above the Taiwanese mountain range.
Signal Quality
Factors that impact the signal quality include poor signal to noise ratios and the strength of the rain rate. If the radar data being processed includes the signal to noise ratio (SNR) as a variable, RadxQpe will use the minimum threshold to determine if the data quality if sufficient or if data from a higher elevation angle is needed. If SNR doesn't exist, RadxQpe will calculate it from the dBZ field.
RadxQpe also allows the user to set the minimum valid precipitation rate (mm/hr). Any precipitation rates below this threshold will be set to 0.
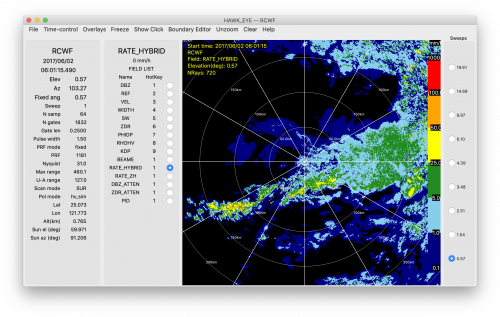
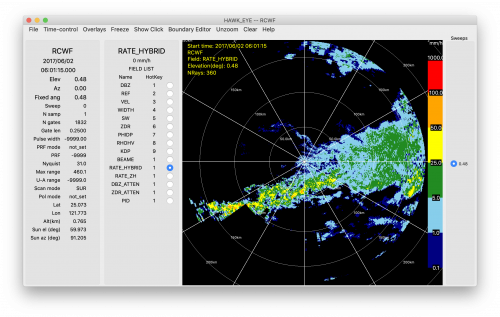
The two images below show the precipitation rate from RadxRate (left image; 0.5º elevation angle) and RadxQpe (right image). In the RadxRate image, the light green color (associated with precipitation rates between 0-3 mm/hr) covers a large area, whereas the RadxQpe image shows far less coverage of the lightest precipitation rates (the minimum valid rate was 0.5 mm/hr for this example).
Radar Beam Height
Due to refraction and curvature of the earth, the height of a radar beam increases with increasing range. Thus, at large distances, the 0.5º sweep is several km above the ground. Since RadxQpe aims to return the estimated surface precipitation, the user can set a maximum beam height above which the precipitation rate will be set to 0.
The two images below show the precipitation rate from RadxRate (left image; 0.5º elevation angle) and RadxQpe (right image). In the example below, the maximum beam height was set to 4 km above mean sea level. All data beyond ~150 km has been removed due to this height requirement.
